Mobility Montreal
Project
Facing the climate emergency, the transportation sector in Quebec is called to undergo a radical transformation to achieve ambitious greenhouse gas emission reduction targets. Quebec’s master plan for energy transition emphasizes that the decarbonization strategy for transportation goes beyond simple incentives to purchase electric vehicles and includes a fundamental reevaluation of modal choices. Therefore, it is necessary to understand the costs associated with these choices, as well as their impact on individuals and society.
Our study proposes a new tool to evaluate the real costs associated with various modes of transport, including walking, biking, driving, and public transport, considering both private, public, and external costs. This tool aims to achieve three objectives: inform citizens about the consequences of their transport choices, provide crucial data for the development of transport and urban planning policies adapted to this transition period, and encourage corporate initiatives toward more ecological transport solutions.
Focused mainly on the agglomeration of Montreal, the study then extends to the entire province of Quebec, highlighting the dominance of automobiles and the urgency to develop sustainable transport alternatives in the region. Our results highlight the economic benefits of active mobility compared to motorized transport, showing that every dollar spent by pedestrians and cyclists saves the society respectively $0.01 and $0.12, while automobiles, with a social cost of $1.55 per dollar spent, and public transport, with $0.49, impose higher collective burdens.
We also identify significant individual disparities in transport choices and costs, influenced by factors such as the number of vehicles per household, gender, and location, with notably higher transport costs for those living in suburbs but working in the city. This diversity of costs and behaviors underlines the importance of transport policies adjusted to specific demographic and geographic realities.
Our study reveals population segments for whom the transition to sustainable transport modes is economically viable without financial sacrifices or time losses. By projecting various modal shift scenarios, we anticipate considerable reductions in budgetary costs and GHG emissions, as well as a notable improvement in public health, with savings potentially reaching nearly $2 billion annually for Montreal alone.
Finally, these results allow for the orientation of urban planning, the design of targeted communication campaigns, and public aids, adjusted to the needs and profiles of the identified populations, to promote awareness of the personal benefits and thus promote more sustainable and environmentally friendly transport alternatives.
Link to the report (pdf) (french only).
La Chaire de gestion du secteur de l’énergie d’HEC Montréal a organisé un webinaire de présentation de l’étude le 17 juin 2024, animé par Pierre-Olivier Pineau. Video is here https://youtu.be/ROLyylonoQA.*
Calculator
Link to the online calculator.
Link to the Excel calculator (xls).
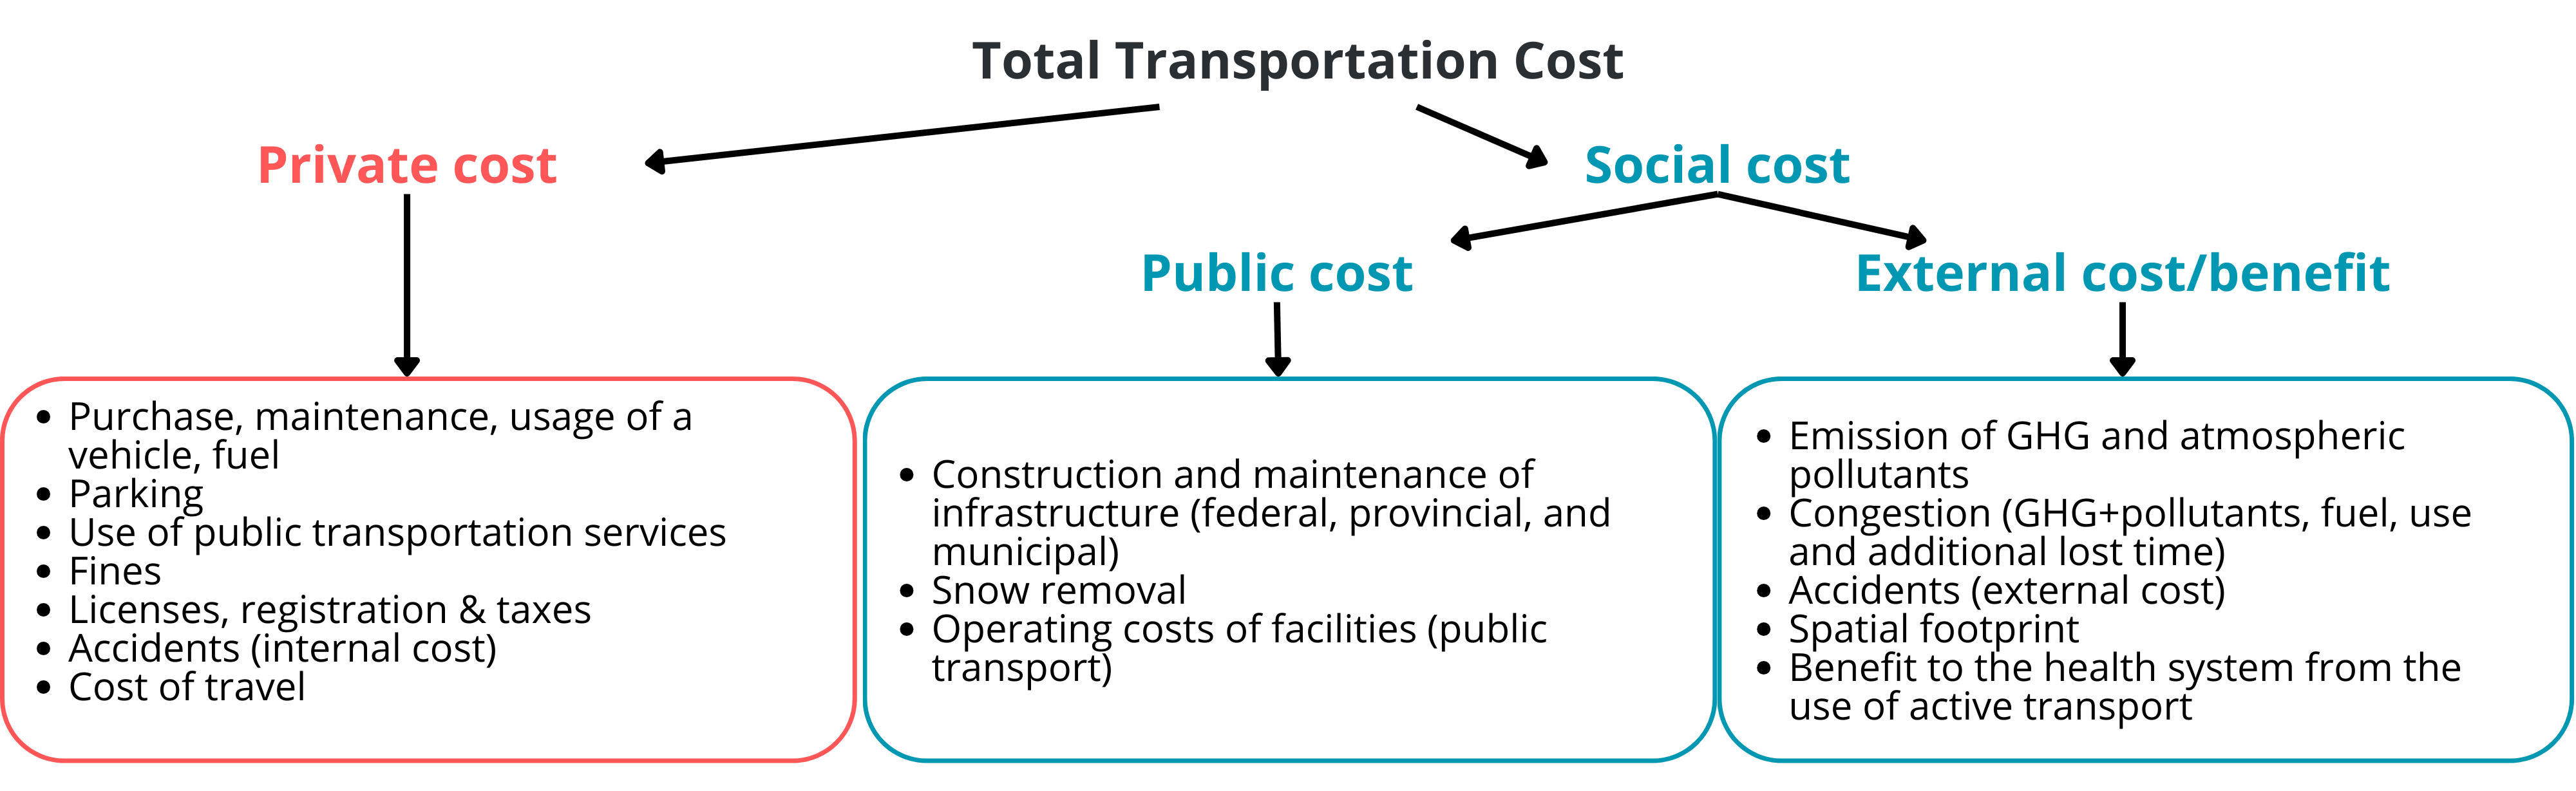
The calculator allows estimating the real cost of different modes of transport - walking, biking, driving, and public transport - taking into account all associated private, public, and external costs.
- Choice of mode of transport and origin: Select your mode of transport and your originating district.
- Distance and travel time: Indicate the distance of your journey (one-way) to get to work or school, as well as the travel time without congestion and the time loss associated with congestion.
- Cost calculation: The calculator uses this information to estimate individual costs and benefits on an annual basis, assuming the journey is made 250 times a year.
The cost categories are as follows:
- Private Costs: directly paid by individuals and include purchases, taxes, direct contributions related to their mode of transport, fines, etc.
- Public Costs: Borne collectively and quantifiable in a budget. They include subsidies, the budget allocated to the maintenance of infrastructure, among others. They are paid indirectly through taxes and taxes.
- External Costs/Benefits: Impacts on the community not directly quantifiable in budgets (GHG emissions, public health benefits, etc.).
Results Summary
Maps
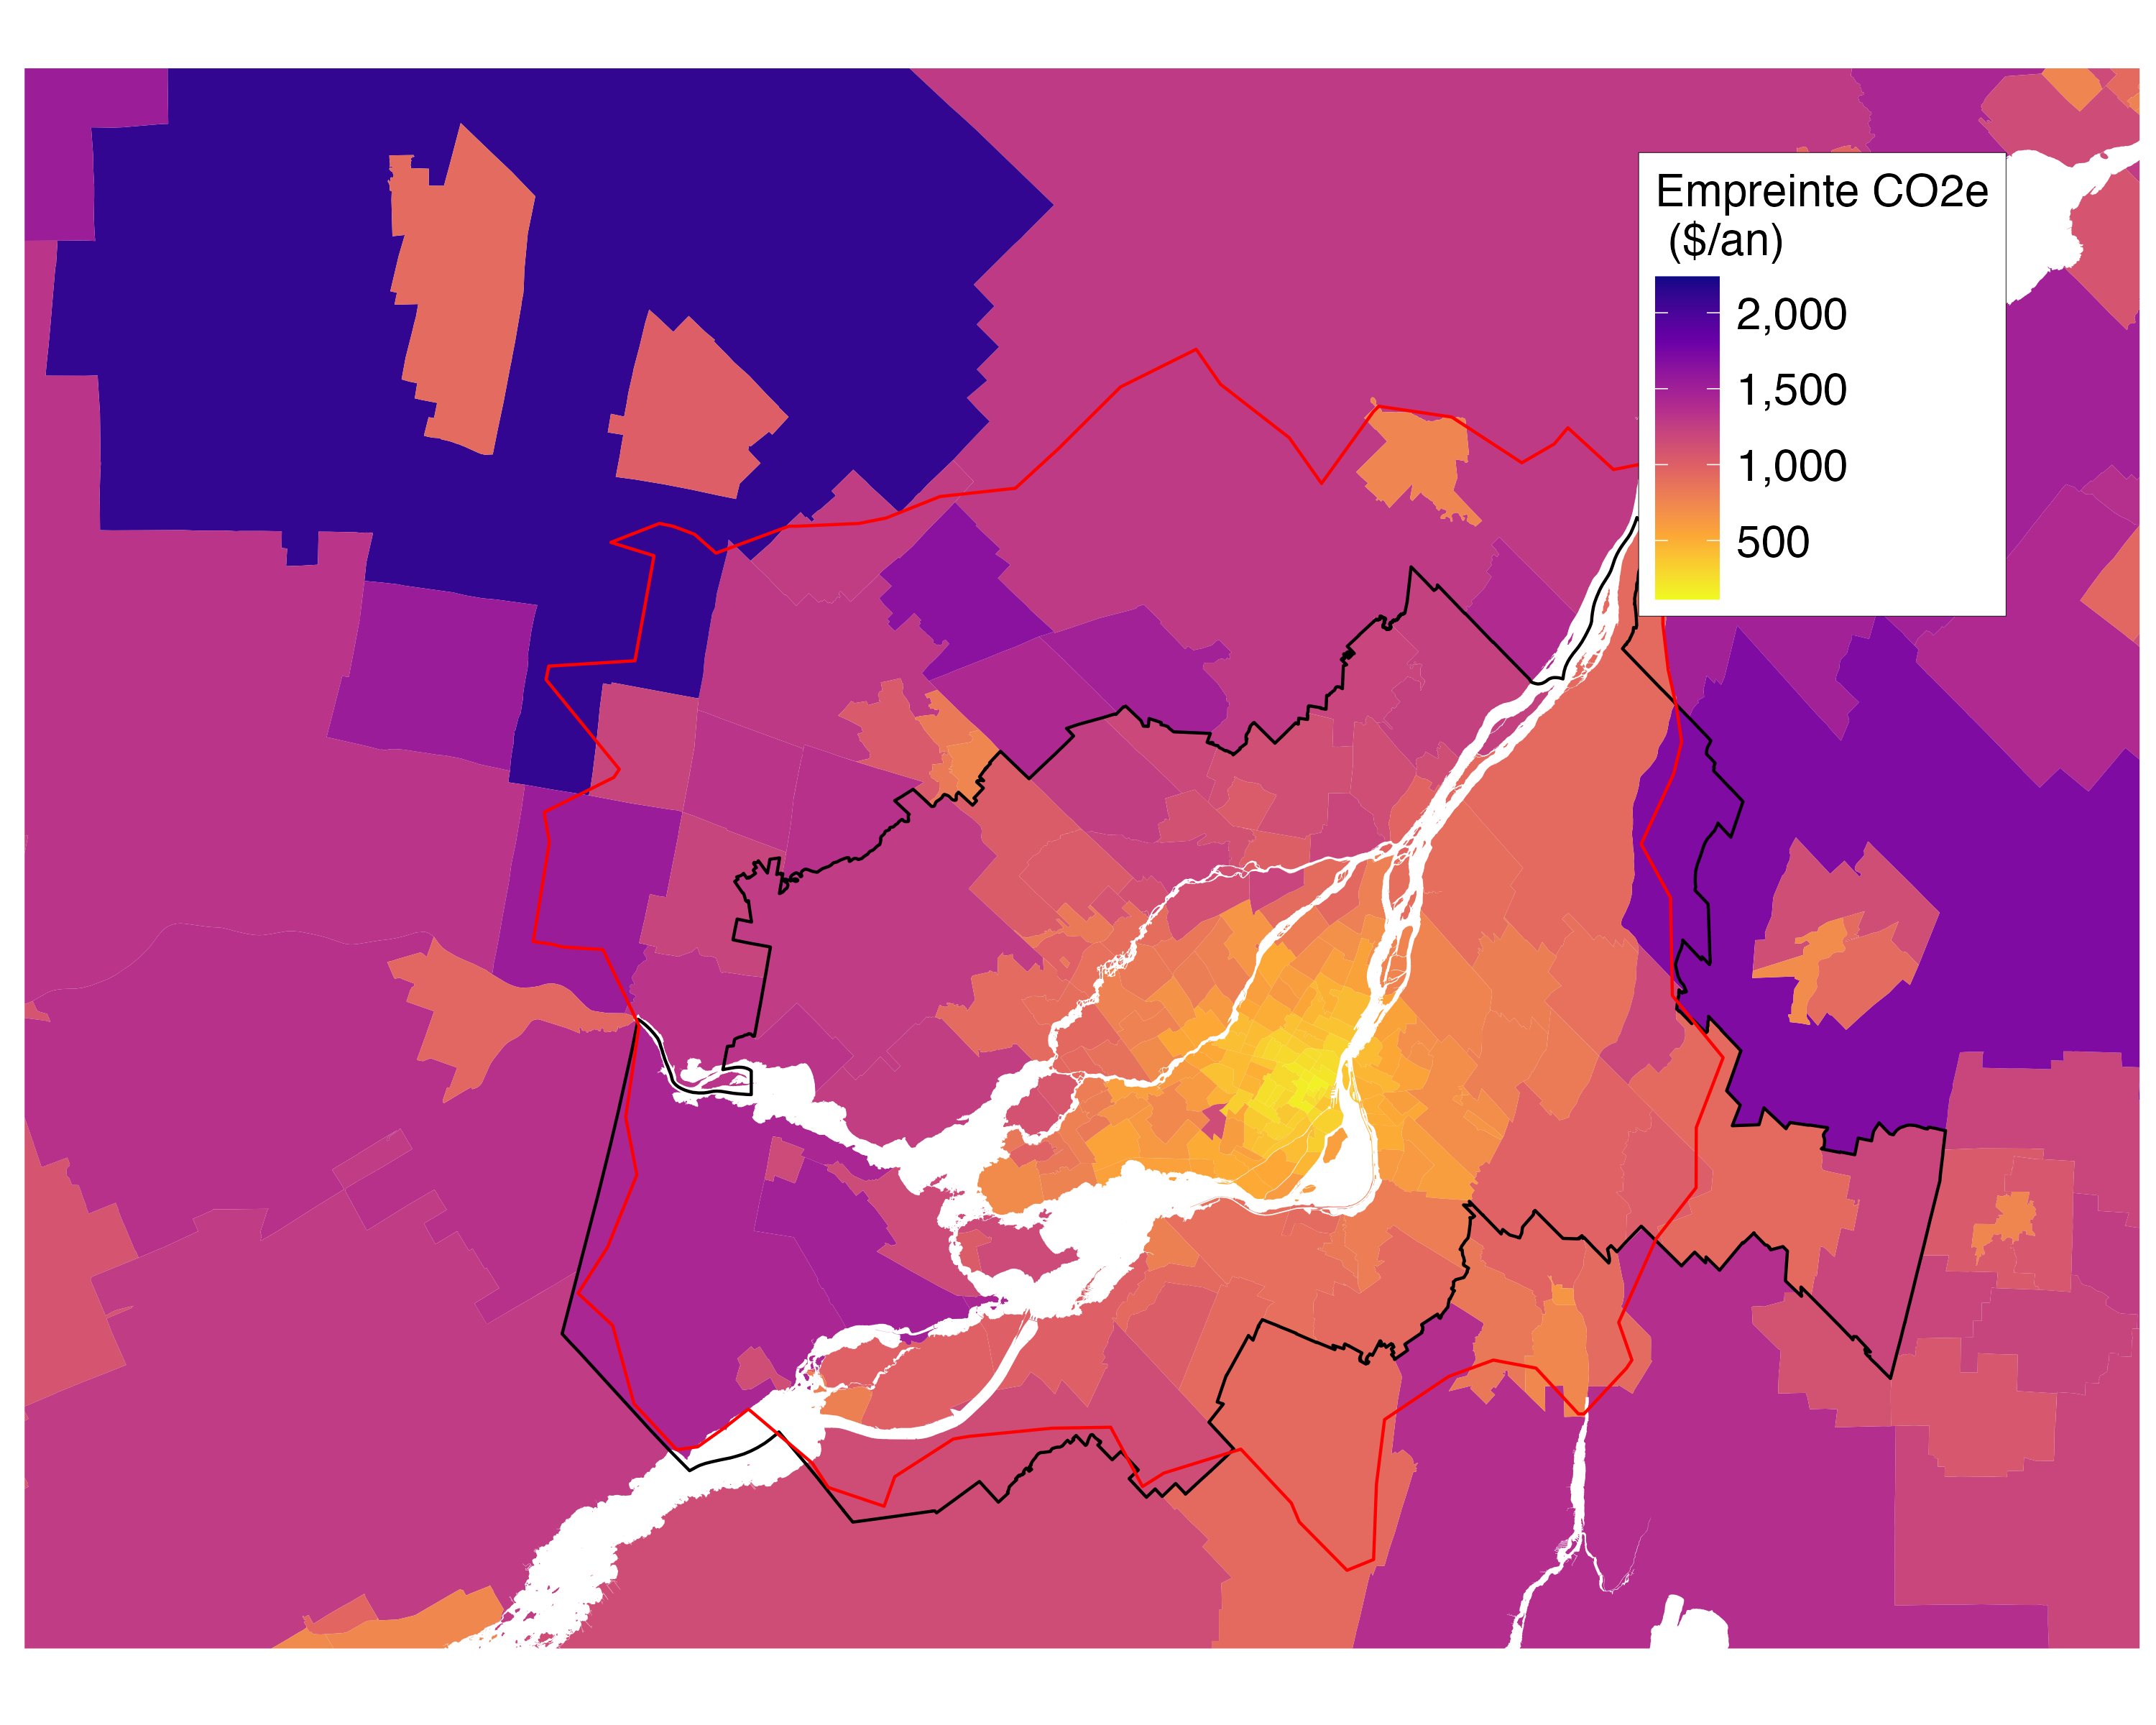
The interactive map below presents data at the RTA level (the first three characters of postal codes) for Canada. It displays annual costs per person (worker or student), as well as other information such as the modal share of automobiles and the average distance traveled by car to get to work or school (one-way). To ensure comparability with other regions, the modal shares reported on this map are from census data, and therefore may differ from the 2018 Origin-Destination data used in the study.
The interactive map below is specifically designed for the MRCs (Regional County Municipalities) of Quebec. This map offers a detailed visualization of annual costs per person, including workers and students, related to their modal choices. In addition to these costs, it presents other important indicators, such as the modal share of automobiles and the average distance traveled by car to get to work or school (one-way journey).
The interactive map below is dedicated to the different regions of Quebec. It provides a detailed analysis of annual costs per person, covering workers and students, based on their transport mode choices. In addition to costs, this map displays key indicators, such as the modal share of automobiles and the average distance traveled by car to get to work or school (one-way journey).
Finally, here is a link to an interactive map hosted on shinyapps.io, which allows exploring various variables by region of Quebec. This interactive map offers a platform for analyzing and visualizing numerous data related to modal choices, annual costs per person, and other relevant indicators. It is a valuable tool for better understanding mobility dynamics and their environmental impact across different regions of Quebec.